Insight – Portfolio Report
Insight – Portfolio Report
The worst thing you can do is install something that is critical to your business, then ignore it. You might hope it all takes care of itself but it won’t. Things go wrong. Staff change. Emphasis is lost.
Insight is designed to present clear useful information about staff performance to help you manage and mitigate risk – in the easiest and most simple way possible.
The Insight – Portfolio Report is the best report to manage a number of centres – simply. This report uses Compliance Percent, the best means to understand performance with respect to slip and trip injury and risk.
‘Portfolio provides both a summary, and also in-depth analysis of performance modes. It can be used by site staff to target problem locations – and by area managers to quickly understand performance.
Insight – Portfolio Report can be used in 2 ways.
- Summary Mode – to show the performance of many centres, one centre per line. This is ideal for getting a quick understanding of performance. This is ideal for area managers, state managers, portfolio managers.
- Deep Analysis Mode – is used to expand out each centre and give detailed and in depth analysis of the centre(s). It is ideal for site staff wanting clear information about problem areas – as well as providing a more targeted analysis of data.
Cutting To The Chase – How Do I Use It?
For management using Summary Mode;
- Look at the compliance percent. If it is less than 75% take immediate action. Contact site. Contact Elite-ID. Ask why it is so low.
- Look at the number of compliant locations (3rd column) and then the percents for entrances, malls and toilets.
- Look at the number of attendances and loggers. Is this super low? Were staff not logging in? Were staff not available?
That takes a few seconds per site. For low performance, phone site staff and asking what happened will improve performance because they will see you care.
For Site Staff using Deep Analysis Mode;
- Look at compliance percent. Less than 75%? Why? Were all staff logging data? Were staff absent? Get reason(s)!
- Expect a phone call from management!
- Are the numbers for Late Start/Early Finish large? Are staff doing pre-cleans or deep cleans instead of starting patroling at start of shift and being delayed? Are staff rostered to leave before end of day? Both these will make your late/early figures poor (higher = bad).
- Look at the High Risk Time Compliance. Is this low? If so your risk of slip and trip is higher than it should be.
- Look at the llist of your worst locations. What went wrong there? Why are they low (less than 75% and worse)?
- Print then show staff the report. Put a highlight pen through the list of worst locations.
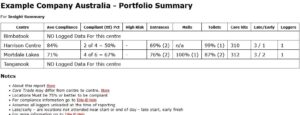
Portfolio Report – Summary Mode
This is ideal for managers needing a top level view of one or many sites, yet at the same time wanting enough information to make meaningful decisions and draw insightful correct inferences backed by data.
You get enough emails a day, right? Well this simple report emailed to you daily will replace many other separate emails – so there only one to open – only one to read. And it is quick and easy!

At a glance, problem sites show up as low compliance percents, problem areas can be identified, and compliance performance is shown and with just a glance, so you can quickly and accurately gauge performance.
The 2nd column of Compliance Percent – is the best means of knowing how staff are performing. A level of 75% is seen by some companies as a bare minimum, while 80% is seen as “good” and at 90% or better is excellent with the incidence of slip and trip injury reduced.
Most of the other columns are self explanatory – we pull out compliances for some grouped areas like entrances, malls, toilets.
The “Late/Early” is an Elite-ID innovation. It shows if staff are not starting work on time properly (late) or finishing early (early). When these numbers get large it means staff are not getting on to the floor properly – they may be distracted with other duties or just late to work. Early finish can be a rostering issue and similarly means staff finish early. Both these ficgures are an indication of enhanced risk at the start or end of day. Minimizing these figures will reduce risk.
The number of attendanfces and loggers is a quick “mental jogger” and a help to understanding some possible glitches. If this is low compared to other days, then it can mean staff were not available or their loggers were not downloaded when the report was run, or both.
Portfolio Report – Deep Analysis Mode
This adds more information and looks at risk times within a day, and areas in addition to the the same summary mode information.
This report is intended to be sent to cleaning supervisors on site – and can also be used by area and state managers o find out why some centres are not performing as they should – and where improvements can be made.
