Graphical Data Display
Graphical Data Display
WebEye is powerful. It lets you visualize and understand your data by many means. Graphical reporting, showing you a picture of your data, is powerful. It helps understanding your data – significantly faster.
Visualizing data with a graphical report really can make understanding it easier. The Location Attendance Report is one of the best possible ways to do this.
The New Maps report also displays valuable information on maps you can load into WebEye and setup with all the locations you log staff at. It is super simple to setup and quick and easy to use. It will give you a snapshot of what is happening on your site(s).
Maps Report (introduced May 2019)
Running this report is as simple as it gets. Select “Now” or give a date and time. The select a Center and the map at the center you want to use.
After that you can filter by job function or user.
Then press “Go” Seconds later the report will show you a map with:
- Each location you have setup.
- The last date and time of an attendance prior to the date and time you entered.
- The number of seconds the staff member was at the location.
- The number of attendances at the location.
- The number of minutes prior that the location was previously attended.
Use this for:
- Spot checks. At a date and time, quickly compare all locations on a map.
- Incident check. Something happens on site. Enter the date and time of the incident. The map will show each location and who was where and when.
- Incident check. Where was security at a date and time?
- Compare one job function to an other. How is Security performing compared to cleaning?
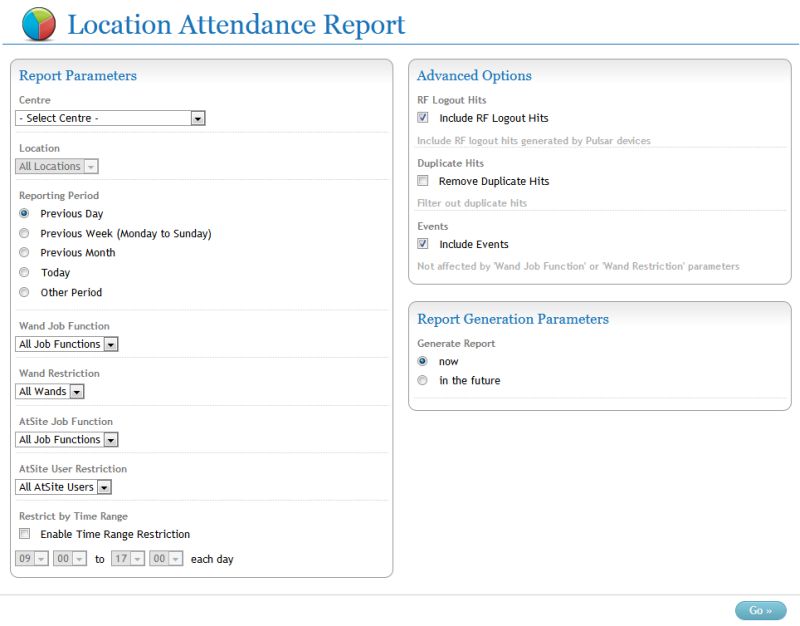
Location Attendance Report
Super simple to setup – just select the center, a location or all, a date range – then you can setup some filtering options.
Not only that – you can also see (enabled usually) any Events in the data you are reporting on, among your data.
Benefits
- Quickly see trends.
- Quickly spot issues. Gaps in data. Late start, early finish, insufficient staffing.
- Visually appealing and easy to understand.
- Filtering, time range setting, tagging of locations all help show relevant data.
Concerns
- A “number” or figure of merit is not produced.
- It is difficult to compare data for different dates.