Location Analysis Overview
Overview
The Location Analysis report gives an in-depth analysis of staff attendances that no other report can match. It suits a wide range of users and applications.
Location Analysis report has 3 report calculation options in the one report. It is the best report to highlight when performance drops below what is required, and to report in ways that make managing many centers, many users, many diverse needs possible and all in the best possible way.

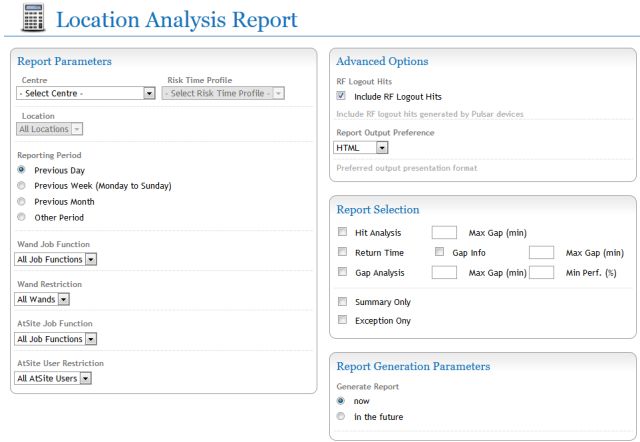
There are three separate analysis methods and calculations, combined into this one report, selected with the checkboxes on the Right hand side.
The report can be scheduled for automatic delivery via email to multiple recipients, and can show all locations or only show non-compliant locations.
This report uses enhanced time profiles that have performance targets for return time minutes and hits by day of the week.
A new “Manage Recipients” home/main menu option manages a list of email addresses so that one user can manage many sites.
New Reporting Options
Location Analysis also introduces new concepts and functions.
Compliant -vs- Non-Compliant – A location that meets your criteria for attendance (example for return time, or for the number of hits, or for gaps or performance percentage and any combination) is said to be compliant. It meets all criteria required. Non-compliant locations fail in some way; for example, the return time may be great, but a gap between attendances may be greater than allowed.
Summary Only Tick Box – This shows the total number of locations processed in a report, and then the number that are compliant and non-compliant.
Exception Only Tick Box – This only shows locations that are non-compliant. Only locations that do not meet performance criteria are shown.
Report Options
Each of the reporting options has their own Knowledge Base article.
Hit Analysis – This is a great report for patrolling security guards or for checking that a location has been attended a number of times between times on selected dates. You can also “work through midnight” to cater for overnight shifts (example 18:00 through to 06:00). There are some great options with this report that make it a valuable addition to most users. For example, you can specify a time and date and a number of hits and also an optional maximum time between hits by day of the week. Those locations not meeting requirements are “non-compliant” and will be shown on a Exception Only report.
Return Time – This calculates the average loop time or return time between attendances at locations. A time profile specifies the target performance by time of day and day of the week, for target return time. Locations not meeting that return time are “non compliant” and will be shown if the Exception Only tick box is selected.n A valuable addition to this simplistic calculation is the addition of a “max gap” field – locations may meet average return time but any with a gap greater than input will be non-compliant.
Gap Analysis – This unique and powerful report calculates the percentage of time that a location meets target. For all gaps greater than the target set in the time profile, the percentage will drop. This is the most true and accurate means of determining performance. Additionally, you can specify what the minimum acceptable performance percentage is, and also the maximum gap – and these will trigger a location to be non-compliant.
